VSM
Vibrating sample magnetometry (VSM) is a method by which hysteresis loops (m vs. H) may be accurately measured. The process is to apply a field across a sample and to measure the moment induced in the sample along the field direction by oscillating the sample near a set of pick-up coils. This is a DC measurement. Hysteresis loops can provide a lot of information about the magnetic nature of a sample. By simple inspection it is clear if the sample is diamagnetic, paramagnetic, superparamagnetic, or ferromagnetic (ferrimagnetic). When actual hysteresis is observed (an opening in the curve) further information about the strength and direction of the anisotropy energy can be deduced. This technique is also a good method to use for probing exchange bias. We use a Quantum Design PPMS for our magnetometry measurements.

Films:
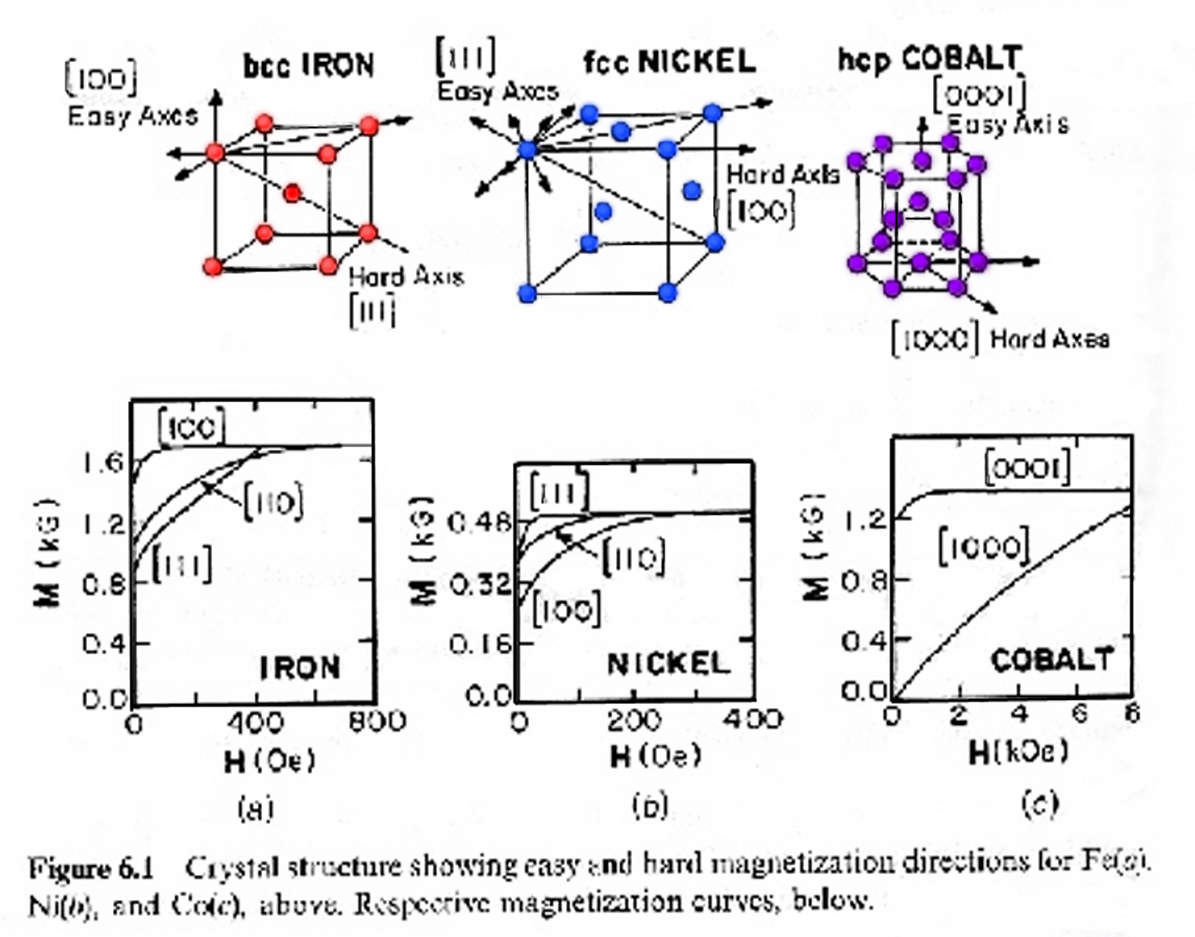
VSM can be used to measure the angular dependence of magnetic anisotropy in single crystal magnetic films. Hysteresis loops are measured for different orientations of, for example, the [100] direction of the film with respect to the applied field. The shape and opening of the loops will show a marked angular dependence for strongly anisotropic materials. When the easy axis is aligned with the field direction there will be a large opening and the loop will be quite square and saturate quickly. For alignment with a hard axis, the opening will diminish, the loop will have more of an “S” shape and will take a larger field to saturate.

R. C. O’Handley, Modern Magnetic Material, John Wiley & Sons, Inc., New York, 2000
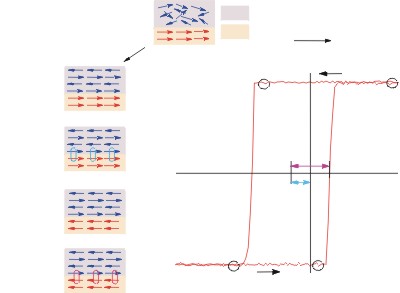
Exchange bias is not a fully understood process, but is known to occur at interfaces
between two different magnetic systems. A simple description of exchange bias invokes
a coupling between a ferromagnetic film and a layered antiferromagnet. The ferromagnetic
layer originally gets pinned by the antiferromagnetic layer producing a delay in the
magnetization switching (with respect to applied field). After the ferromagnetic layer
switches it is in a high energy state of anti-alignment with the antiferromagnetic
layer. Thus, the switching back to the aligned state occurs earlier than the flipping
normally would. The result is that the hysteresis loop is shifted horizontally and
is no longer symmetric about the field axis.
(Left) Schematic diagram of the spin configuration of an AFM-FM bilayer at different stages (A - D) of an exchange biased hysteresis loop. Note: this is a simple cartoon to illustrate the effect of coupling. (Right) Magnetic hysteresis curve showing two coercive fields (HC1 and HC2) and the exchange bias HEX.
Particles:
The magnetic nanoparticles that we study are superparamagnetic systems. They can be
described as paramagnets with ‘super’ magnetic moments. As opposed to the simple paramagnet
that has a moment of a few Bohr magnetons, our particles have moments between a few
hundred and tens of thousands of Bohr magnetons. Their magnetization curves can be
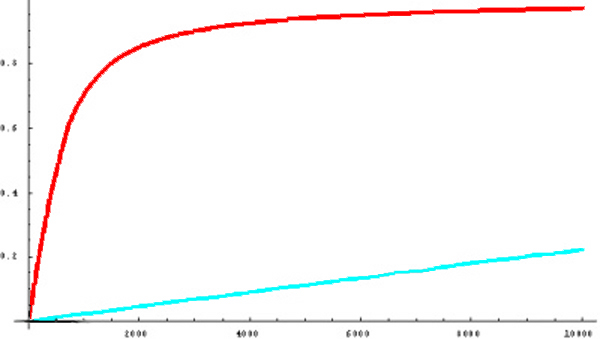
described by the classical paramagnetic Langevin function. By fitting our data to
this equation we are able to extract the magnetic moments of our particles.

Langevin curves at T = 100 K. The axes are applied field (Ga.) for x and magnetization (normalized) for y. The curved graph is for a particle moment of 5000 mB and the ‘straight line’ is for a moment of 5 mB (x20). The straight line will eventually curve over, but not until enormous fields such as 100 T or more.
Unfortunately, when the anisotropy energy becomes comparable to the thermal energy the Langevin function (which does not account for anisotropy energy) fails to reproduce the data. This is due to the fact that the system can get ‘stuck’ in a non-equilibrium configuration (local energy minima instead of global minima) when there is not enough thermal energy to overcome the anisotropy barrier (hence, we observe hysteresis). At this point to becomes necessary to invoke other models.
